|
Rajon Blog
|
||||
|
|
||||
 |
|||||||
|
SUNSPOT HARMONICS PART TWO SUNSPOT SOLAR ACTIVITY CYCLE. (Please remember that all this data is current research being done and we are sharing it with you as time progresses. Some statements are calculations and may not occur but are stated as possabilities until all the raw data is collected. So you are sharing in the discovery as it is taking place.)
Update 19th April 2001 To date we have had solar flares on the following harmonics 3rd April 2001 = 28.58333 x20 type flare 15th April 2001 = 53.58333 4th largest flare on record If we follow the same pattern then we can expect a flare of large proportions on the 21st,27th and the 30th. The one on the 27th is the problem child at 78.58333 it also falls within the earth sphere of rotation as per present data. The reason for the 27th is that the larger flares are occurring every 12 days but at different locations thus so far earth has missed but as they say 3rd time lucky. or unlucky depending on how you look at it. It is obvious that there is a pattern to this and if we could follow it for the next few months then we think it would fit into the harmonic calendar perfectly. We must remember that back in 1989 on the 6th March = 53.25 harmonic this flare knocked out the Canadian power grid. Then on 16th August 1989 = 65.75 x20 type flare largest on record at the time occurred. The reason for the different phase change in the harmonic values is due to galactic shift thus creating a different energy influence on the sun. ie:integer (.00,.25,.50,.75) .666 and .333 phases. These number variables represent the 3 energies that make up our 3 dimensional space. You could also take the year harmonic of 1989 as 165phase being one octave lower than 2001 which is 166.
For those of you not yet in the know the sunspot cycle on the sun has an eleven year cycle. That means from peak to peak takes 11 years. We know that it peaked around 1989/1990 so the next peak should be around 2000/2001. Harmonics for the year 1989/1990 are 165.75/165.83333 Whereas the harmonics for 2000/2001 are 166.6666/166.75 So if were to pick a year for sunspot peak activity it would be 2001. March/April as before as the cycle rises by 1 octave so the strength of the surface eruption would be greater than berofe due to the rise in the 165.75 to 166.75 that equals one octave or 15% increase in strength energy wise. Nowadays we have a caledar that can accurately plot when the next solar peak will occur and to what strength higher of lower than before. The numbers speak for themselves!! Update as of 30th March 2001. News Report on BBC. By BBC News Online science editor Dr David Whitehouse: Two major flares have erupted on the surface of the Sun in the region of the giant sunspot group designated Noaa 9393.
Now let's for arguments sake look at the 1947 situation and apply the harmonic calendar to it.
The left column is the low cycle and the right the high! There is an occassional shift in the cycle but we can allow that as the timing of our gregorian calendar does not exactly match the Harmonic cycle which is aligned to the solar rotation. Got you interested yet???
So who says this does not work. It has matched the past records so would logically match the forward occurances. You can email us for more info at contact |
|||||||
|
(c) Copyright 1993-2008 Rajon Publishing |
|||||||
 Stationed just 1.5m km from the Sun, the Esa/Nasa Soho satellite captured this thrilling image on Friday.
 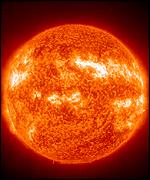 The group is the biggest seen on the surface of our star for more than a decade. One of the flares (explosions in the Sun's atmosphere) was so energetic that it ejected a cloud of superhot gas into space. Solar observers say that the cloud, called a coronal mass ejection (CME), is heading towards the Earth and will reach us within the next 24 to 36 hours. Scientists are predicting a "geomagnetic storm" when it reaches us. There may be radio and communications interference, and possibly a fine display of the Northern, and Southern, Lights, visible from lower latitudes than is usually possible. Very excited Geoff Elston, director of the solar section of the British Astronomical Association (BAA), has been studying the monster sunspot, Noaa 9393, for several days.
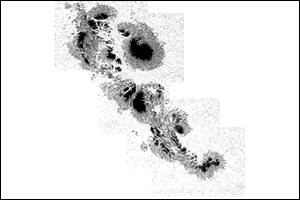
 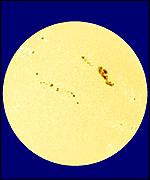 The current activity has caused huge excitement (University of Hawaii) "It is definitely the largest we have seen for a long time, probably for many decades," he told BBC News Online. "It has overtaken the size of the most recent large one that occurred in March 1989." Elston said observers did not think the spot would get any bigger. "Over the past day or so, it has shrunk a little and this trend is likely to continue. It's probably past its best." Noaa 9393 has provided astronomers with an insight into the complicated way magnetic fields behave on the Sun's surface. Record holder Researchers were able to observe the dynamic interface between two regions of the sunspot that had opposite polarity. It was along the dividing line between the spot's north-pole and south-pole regions that the big flare took place. Magnetic energy was released along the interface and turned into heat. This caused the explosion and the CME. Although very large by normal standards, Noaa 9393 is way short of the all-time record holder. That title is held by a spot group which appeared in 1947. It was three times larger than Noaa 9393. Sunspots are magnetic regions on the Sun's surface. More of them appear on the Sun during the time of solar maximum, which happens every 11 years. Astronomers believe that 2000-1 is the time of the current maximum.